Know what you're working with
As a developer at some point you face the daunting task of working on code you didn't build. Software archeology is a methodology to help you determine how to deconstruct inherited software source code. Although getting the information by hand is possible, it's tedious and time-consuming. Using a set of tools reduces the time needed to generate data to help you move forward with development. For Java developers, JBuilder gives you software archeology tools and functionality on top of the base Eclipse SDK to put your project on a highly efficient and productive track. The following is a summary of the software archeology process for Java using JBuilder 2008.
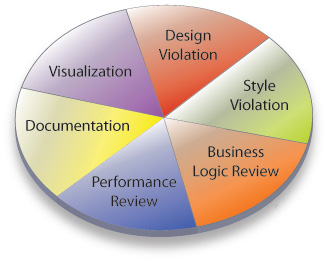
The six-step process for reviewing what is there and what is not to help you define your project development strategy
Visualization: Getting a picture
JBuilder 2008 comes with LiveSource™ that will reverse and forward engineer Java code. This means that if you inherited a large amount of Java code, JBuilder can reverse engineer the code and produce a series of UML diagrams. And since it uses LiveSource™, any changes made to the diagrams will result in the code being changed and vise-versa. So the code and diagrams are always in-sync. This gives your developers an advantage when trying to understand what has been inherited with a code base.
Design Violations: Understanding the health of the object model
It is also important to get an understanding of the health of the object code. One of the fastest ways to do this is to run software metrics on the code. Metrics give you information about the code's construction and strength as well as the weak or problematic spots. JBuilder includes over 80+ software metrics such as the simple Lines of Code, the more in-depth Cyclomatic Complexity, Instability and others, to help report on the health of the code. Once JBuilder has generated the metrics, a Kiviat graph helps developers better visualize the health of the code.
Style Violations: Understanding the current state the code
Once developers understand the health of the code from a structural standpoint, they can move to uncovering issues that can cause errors, bugs, or misunderstandings going forward. JBuilder includes over 200+ code audits that find possible performance issues, potential errors, and duplication of code.
Business Logic: Testing the existing source
One of the most important processes with today's complex systems is good testing. Ironically, most code that goes through the process of Software Archeology has very limited testing. If you don't do simple testing on the code, it is hard to harvest patterns, change the code in any meaningful way, or integrate with other systems. It is important to be confident with the code's functionality. JBuilder fully supports JUnit and many other great testing tools to help make certain your developers understand that the code functions exactly how it should.
Performance: Locating the bottlenecks in the source code
Performance reviews are also essential. When you use JBuilder for software archeology, it helps point you to where the code is slow or does not perform well. JBuilder also comes with the JOptimizer technology, which includes both a Java Profiler and a Web Java Profiler. These features can help developers find the exact line or location of the code that is causing the performance issues. The general rule is that less than 5% of the code causes 80% of the slow down, JBuilder helps you fix that 5%.
Documentation: Assessing documentation adequacy so people understand what they are working on
It is important that any diagrams, tests, metrics, audits and performance data become part of the overall code documentation set. JBuilder provides Documentation Generation functionality. When you generate a UML diagram it becomes part of the overall documentation. When you run a metric or audit, those become part of the documentation. This feature allows future developers to have a better understanding of the code, and the ability to share the information.